Case Study · Only Took Five
TWO DAYS
AT BOULÉ
Zeta Phi Beta’s national convention happens once a year. Only Took Five booked two recording days. Same media buyer before and after, same ad account, same audiences, same offer — the footage is the only thing that changed. Cost per purchase fell from $42.54 to $16.99 while the budget tripled.
- Client
- Only Took Five
- Sector
- Sorority apparel, DTC
- Booked
- 2 recording days
- Scope
- Capture, edit, paid media, storefront
- Measured
- 9 Jul – 24 Aug 2026
THE ONLY THING THAT CHANGED WAS THE CAMERA
Same women. Same product. Same ballroom. Same ad account, same audiences, same offer. Before the shoot the ads ran on phone footage. After, they ran on this.
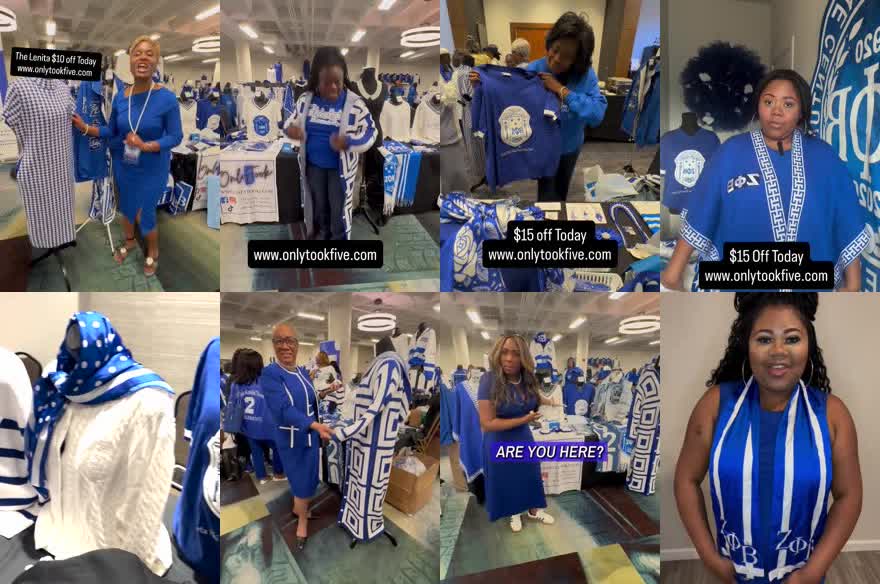
Flat overhead ballroom light, everything equally in focus, vendor clutter behind the subject, and a burned-in discount box doing the selling.
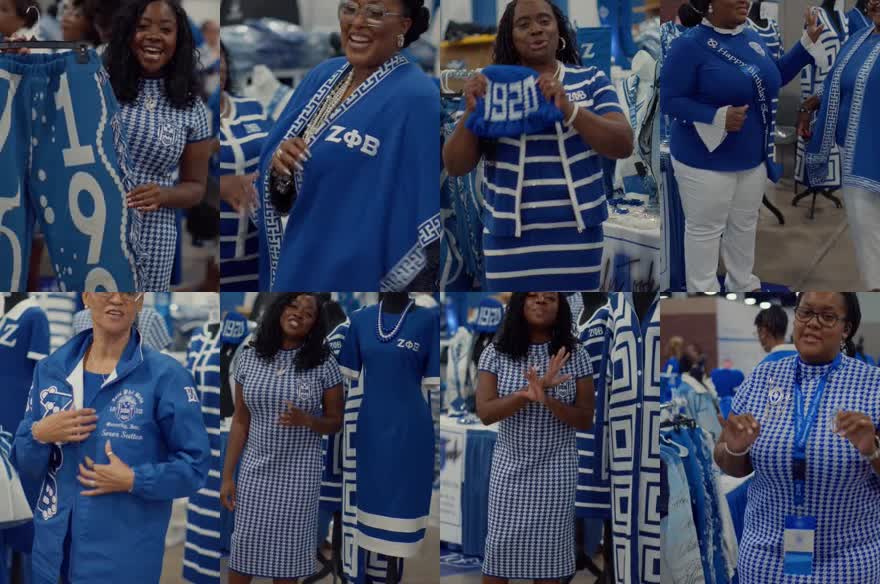
Shallow depth of field separating the subject, controlled exposure, tight on the face and the garment, one grade across every clip. No discount box.
WHAT IT DID
The 46 days after the shoot, measured against the 46 days before it. Store figures from Shopify, cancelled orders excluded.
Tripling a budget normally makes cost per purchase worse. This one fell by 60%.
REVENUE, DAILY
The convention ran 6–11 July and sold almost nothing on its own: $733 across the 6th, 7th and 8th. Revenue starts when the footage gets deployed and the rebuilt store goes live on the 12th.
PAID MEDIA
I was already running these ads before the shoot, on the client's phone footage. Same hands on the account, same audiences, same products. That makes this a clean read on creative: swap the raw material, hold everything else, watch what moves.
| Metric | Before · phone | After · cinematic | Change |
|---|---|---|---|
| Budget | |||
| Total spend | $2,893 | $8,956 | 3.1x scaled |
| Daily budget | $63/day | $195/day | 3.1x |
| Efficiency | |||
| Cost per purchase | $42.54 | $16.99 | 60% cheaper |
| Return on ad spend | 2.68x | 7.23x | 2.7x |
| Cost per 1,000 impressions | $18.16 | $15.79 | 13% cheaper |
| Cost per click | $0.21 | $0.20 | 5% cheaper |
| Volume | |||
| Purchases | 68 | 527 | 7.8x |
| Attributed revenue | $7,744 | $64,749 | 8.4x |
| Impressions | 159,247 | 567,183 | 3.6x |
| People reached | 43,503 | 101,242 | 2.3x |
| Link clicks | 14,074 | 45,407 | 3.2x |
| Funnel | |||
| Landing page views | 6,602 | 19,757 | 3.0x |
| Add to cart | 1,391 | 7,131 | 5.1x |
| Reached checkout | 226 | 1,414 | 6.3x |
| Visit to add-to-cart | 21.1% | 36.1% | 1.7x |
| Visit to purchase | 1.03% | 2.67% | 2.6x |
| Honest notes | |||
| Click-through rate | 8.84% | 8.01% | 9% lower |
| Average video watch | 7.0s | 6.0s | 1s shorter |
| Median frequency, per ad | 1.51 | 1.27 | 16% lower |
| Highest single ad | 2.22 | 6.45 | one scaled winner |
Click-through and watch time dipped slightly on far greater volume. Those are shown because they are real. Frequency is reported per ad, not per campaign: campaign-level figures aggregate overlapping audiences and read alarmingly high. The typical ad was seen less often after the shoot, because 55 creatives shared the load instead of 13.
THE WINNERS
Five creatives carried this account. Four of them are still underfunded — the highest-returning ad in the whole window ran on $455.
| Creative | Return | Spent | Cost / purchase | Next move |
|---|---|---|---|---|
| Macy Dress Best return in the account and barely funded. This is the one to pour budget into. | 10.74x | $455 | $13.03 | scale |
| Stacie Shawl The workhorse, 170 purchases. Fatigued at week four, recovered when rested. Needs new cuts. | 9.88x | $2,097 | $12.53 | refresh |
| CIN_Lenita_Dress Burned out fast on small spend. Fresh variants should run again. | 8.53x | $547 | $12.99 | scale |
| 25 for 25 Newest creative, launched 13 August. Still climbing. | 6.67x | $1,497 | $13.51 | scale |
| Made by Sorors Ran eight weeks on $468. Underfunded the whole time. | 7.10x | $468 | $14.20 | scale |
| Cut these | ||||
| Tapestry Pants Three sales in four weeks. The product sold $2,705 elsewhere, so the creative was the problem, not the item. | 0.41x | $886 | — | kill |
| Dr. Stacie NC Grant Zero sales. | 0.00x | $293 | — | kill |
Macy Dress returned 10.74x on $455. Stacie Shawl got $2,097. The budget is on the wrong ad.
EVERY WINNER HAS A HALF-LIFE
Return on spend by week, for each ad's own lifetime. The shape is the same every time: open enormous, halve within a fortnight, settle near break-even. This is what running out of footage looks like.
Stacie Shawl
$2,097 spent · 9.88x lifetime
week 1 → week 6
week 6 = spend cut to $134, audience recovered
Macy Dress
$455 spent · 10.74x lifetime
week 1 → week 5
CIN_Lenita_Dress
$547 spent · 8.53x lifetime
week 1 → week 3
spend fell too, so this is fatigue and not scaling
Cost per purchase, weekly across the account, tells the same story: $9.50 → $13.28 → $18.67 → $28.03 as the library aged. Then “25 for 25” launched on 13 August and the account jumped back to 8.12x the same week — on only three posts. New creative reset it, not posting harder.
| Week | Posts published | Ad spend | Return | Cost / purchase | Store revenue |
|---|---|---|---|---|---|
| W1 07-09 | 22 | $627 | 15.98x | $9.50 | $19,886 |
| W2 07-16 | 6 | $1,448 | 10.97x | $13.28 | $24,052 |
| W3 07-23 | 3 | $1,661 | 5.70x | $18.67 | $14,548 |
| W4 07-30 | 3 | $1,654 | 4.10x | $28.03 | $9,693 |
| W5 08-06 | 8 | $1,420 | 4.99x | $25.82 | $11,623 |
| W6 08-13 | 3 | $1,419 | 8.12x | $12.45 | $17,974 |
| W7 08-20 | 2 | $752 | 5.30x | $21.49 | $5,400 |
THE REBUILD WE REVERSED
When the engine started fatiguing, the obvious move got made: pause it, launch a cleaner rebuild. That decision was reversed the same day. Here is what the data actually said.
Frequency, by the level you read it at
the same campaign, four different answers
| Account-level, 30 days | 5.42 | aggregate |
| Account-level, 14 days | 5.99 | aggregate |
| Ad-set level, 7 days | 3.68 | aggregate |
| Per ad, actual range | 1.12 – 2.27 | what a person sees |
Aggregate frequency stacks overlapping audiences across every creative in rotation. No actual person saw an ad more than 2.27 times.
Purchases per week vs the learning threshold
Meta needs 50 a week to exit learning
Peaked at 114 in a week — 2.3× the threshold. The campaign had cleared learning twice over.
Aggregate frequency overstated the fatigue
The account read 5.4–6.0 and the ad set 3.7. But no individual person was seeing an ad more than 2.27 times. Aggregate frequency stacks overlapping audiences across a dozen creatives — with that much variety in rotation, people were seeing range, not repetition. Judge fatigue per ad, never per ad set.
The learning phase was never the constraint
Meta needs 50 conversions a week to exit learning. This campaign hit 109 in week two and 114 in week six — more than twice the threshold. At the cycle's best cost per purchase, roughly $67/day clears it, and the campaign was running at $150–195/day. Spend was never what was holding it back. Creative freshness was.
A rebuild pays a learning tax the refresh avoids
The replacement campaign's weak first hour was not a bad campaign — it was cold-start learning, exactly what you would expect. Restarting throws away accumulated optimisation on an account that had already cleared learning twice over.
It also throws away stacked social proof
Boosting published posts compounds likes, comments and shares onto one asset over weeks. A fresh campaign starts that at zero. There is no way to rebuild it on day one, and it is a real part of why the originals converted.
Fresh creative was already in hand
Which made the choice easy. Injecting new cuts into a campaign that had already learned the audience was strictly better than asking a new campaign to learn it again from nothing.
When a proven campaign fatigues, refresh it. Don’t replace it. Fatigue is a creative problem, not a structural one.
WHO BUYS, AND WHERE
Where the money actually worked. Every figure below is from the same 46 days.
By age and gender
| 55-64 female | $2,565 | 9.16x |
| 65+ female | $1,350 | 7.48x |
| 45-54 female | $2,893 | 7.40x |
| 35-44 female | $1,190 | 5.97x |
| 25-34 female | $382 | 5.80x |
| All male | $399 | 0.10x |
| 18-24 female | $137 | 0x |
Return climbs with age. Everything under 35, and every male segment, is waste.
By platform, and by campaign
| $7,163 | 7.88x | |
| $1,780 | 4.42x | |
| Cinematic Content Sales | $6,797 | 8.95x |
| 25 for 25 | $383 | 8.52x |
| OT5 | Scale 2026-08 | $297 | 0.36x |
Facebook carries the revenue; Instagram builds the audience. Sales campaigns only — the awareness campaign is measured separately below.
THE AWARENESS BUY, MEASURED PROPERLY
A fourth campaign ran alongside these on OUTCOME_ENGAGEMENT — optimised for reach, never for purchases. Scoring it on return on ad spend would score it by a metric it was not built to produce, so it is measured on its own terms here.
What $1,505 bought
OUTCOME_ENGAGEMENT
| People reached | 70,243 | $21.43 / 1,000 |
| Link clicks | 7,377 | $0.20 each |
| Post engagements | 60,990 | $0.02 each |
| Video views | 47,622 | $0.03 each |
| Page likes | 647 | $2.33 each |
| Add to cart | 237 | $6.35 each |
It reached 70,243 people against the sales campaign’s 101,242, on a fraction of the budget. Twenty-cent link clicks are a strong buy by any standard.
Where it underperforms
against the sales campaign
| Cost per landing page view | $1.56 | $0.40 | 3.9x worse |
| Cost per add-to-cart | $6.35 | $1.10 | 5.8x worse |
| Add-to-cart to purchase | 1.7% | 7.9% | 4.6x worse |
A strong awareness buy and a weak traffic-quality buy. Both are true at once.
It also logged 7,377 link clicks against only 962 landing page views — a 6,415-click blind spot, the population that in-app browsers and tracking prevention swallow. Some of them bought later and were booked as direct or organic. That leak cannot be sized from the data, but it is large enough to understate what this campaign contributed. Meta does not expose follower attribution per campaign, so its share of audience growth is unprovable in either direction.
THE ORGANIC ACCOUNT CAME WITH IT
47 posts published in 46 days, all cut from the same two days of footage. None of this is paid reach.
Profile visits rising nearly 12x is the clearest signal in the set: people saw the work and went looking for the brand. Follower history is capped at 30 days by Meta, so the 9 July baseline cannot be recovered.
WHAT THESE NUMBERS DON’T PROVE
Everything above comes from the client's own Shopify and Meta accounts. Here is what an honest reading has to concede.
Read this before you quote a multiple
- Content, ads and the storefront all changed together. They were one engagement and cannot be separated. The claim is the system, not a single lever.
- A national convention ran concurrently. The daily curve argues against it as the cause, but it cannot be ruled out entirely.
- Meta claims $64,749 of the $103,176. The rest came through direct, email and organic, which no platform attributes cleanly.
- About 88 of the 923 orders were manual invoices, not storefront checkouts.
- One ad ran to 6.45 frequency. It was the top performer and still returned 9.92x, but it is the first thing to refresh.
- $889 went into an ad that returned three sales. Testing volume found the winners; it is not free.
- Engagement campaigns are systematically undercounted here. Platform ROAS credits the last click. A campaign optimised for reach will always look worse than one optimised for purchases, whatever it actually contributed.
The cleanest evidence is August on its own: no convention, storefront settled, and return on ad spend still holding at 5.81x against 2.68x before, on 2.6x the daily budget.
SO WE STOPPED GUESSING
Two days of shooting fed this account for about six weeks before the library thinned out and efficiency slid. That is not a failure of the footage — it is the shelf life of any creative. So the shoot stopped being a one-off and became a schedule.
Long enough to sell through a library, short enough that fresh creative lands before the winners fatigue.
When cost per purchase reaches three times its week-one figure, the next shoot moves up. It hit $28.03 against a $9.50 open.
Every winner roughly halved within two weeks of active spend. New cuts have to enter continuously, not in one batch.
Two days, timed to a new product drop. Baselines frozen the night before so the next read is clean.
WHAT THIS COSTS TODAY
This engagement was priced privately and predates the current rate card. Booked today, the same capture scope reserves like this.
- 2 Full Days capture — 8 hours each
- $5,000
- Legacy delivery package
- $7,500
- Total, booked today
- $12,500
Paid media management is a separate monthly retainer and is not included above.
Against $103,176 in store revenue over the 46 days that followed. The next two days are booked for 4 September.
Figures pulled 24 August 2026 from Only Took Five’s Shopify Admin API and Meta Ads and Instagram insights. Windows are equal length: 24 May – 8 July against 9 July – 24 August. Cancelled orders excluded. Published with the client’s permission.